1
2
3
4
5
6
7
8
9
10
11
12
13
14
15
16
17
18
19
20
21
22
23
24
25
26
27
28
29
30
31
32
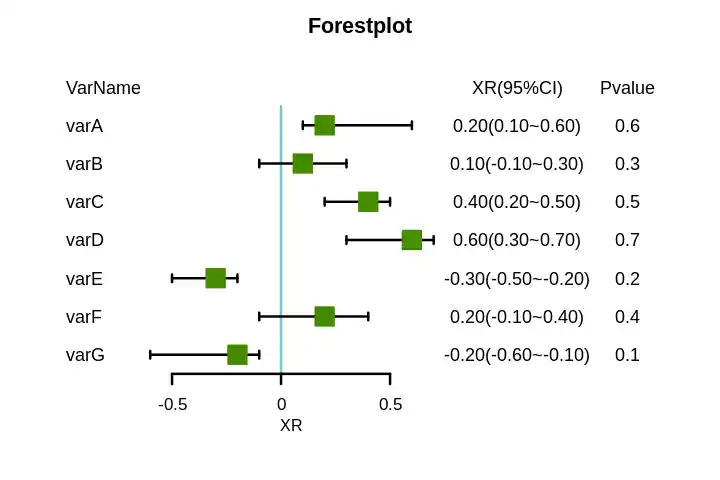
| require(forestplot)
f_forestplot <- function(df, xlab="XR", zero=0, lineheight=unit(10,'mm'), colgap=unit(2,'mm'), graphwidth=unit(60,'mm'), title="Forestplot"){
df_labeltext <- df[,c('VarName', 'Pvalue')]
df_labeltext[[paste0(xlab,'(95%CI)')]] <- paste0(sprintf("%0.2f", df$mean),'(',sprintf("%0.2f", df$lower),'~',sprintf("%0.2f", df$upper),')')
df_labeltext[['Pvalue']] <- sprintf('%0.1e', df_labeltext[['Pvalue']])
df_labeltext <- rbind(colnames(df_labeltext), df_labeltext)
df <- rbind(rep(NaN, ncol(df)), df)
forestplot(labeltext=as.matrix(df_labeltext[,c(1,3,2)]),
mean=df$mean,
lower=df$lower,
upper=df$upper,
zero=zero,
boxsize=0.5,
lineheight=lineheight,
colgap=colgap,
graphwidth=graphwidth,
lwd.zero=2,
lwd.ci=2,
col=fpColors(box='#458B00',
summary='#8B008B',
lines = 'black',
zero = '#7AC5CD'),
xlab=xlab,
lwd.xaxis =2,
txt_gp = fpTxtGp(ticks = gpar(cex = 0.85),
xlab = gpar(cex = 0.8),
cex = 0.9),
lty.ci="solid",
title=title,
line.margin = 1,
graph.pos=2)
}
|